

Assignment 10
Exploring the Parameters
by
Megan Dickerson
To examine Parametric curves in Graphing Calculator, I first looked at
x = cos(t)
y = sin(t)
![]()
This generates the unit circle.
Next I decided to examine:
x = a cos(t)
y = b sin(t)
![]()
As a and b change, different ellipses are formed. The value for a is the length of half of one axis (left to right - x), and b is the length of half of the other axis (up and down - y). So, when a < b the ellipse is tall up and down.
This graph shows a=2 < b=5
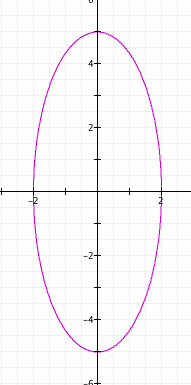
When, a > b, the ellipse is long left to right.
This graph shows a=4 > b=2
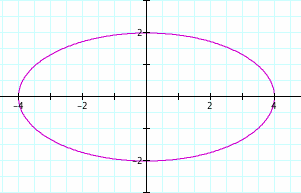
When a = b, a circle is formed with radius = a = b.
This graph shows a=3=b
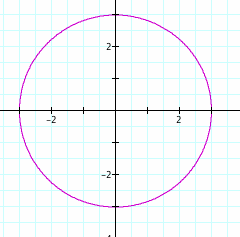
Then I examined the equations:
x = 4cos (at)
y = 3sin (bt)
in comparison with the Lissajous Curve:
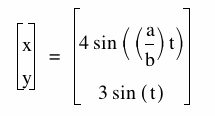
To get a good look as to how these curves act and differ, I looked at multiple values for a and b. I will post my findings for a = 1,2,3,4,5,6 and b = 6.
From the last examinations I discovered that the coefficients 4 and 3 just give the x and y values for how tall and wide the graph will be. I also noticed that as a > b the graph will be taller up and down, but otherwise similar to the graph of a < b, so I will just show the graphs when a < b.
Here are my graphs:
[x = 4cos (at); y = 3sin (bt)] curves are on the left.
Lissajous Curve graphs are on the right.
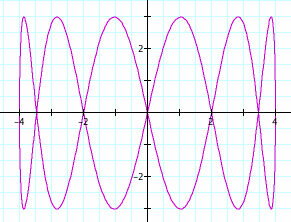
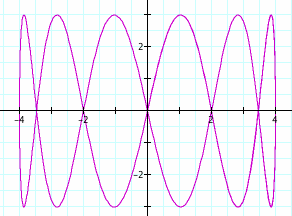
a = 1
b = 6
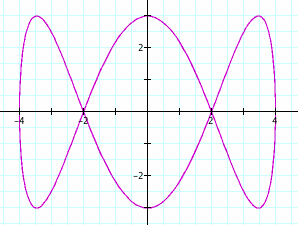
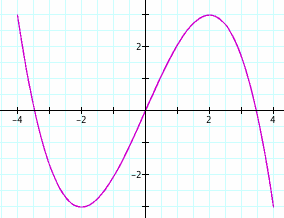
a = 2
b = 6
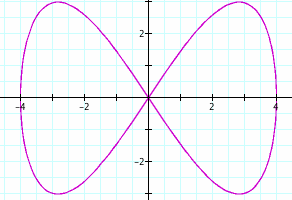
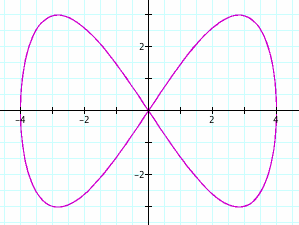
a = 3
b = 6
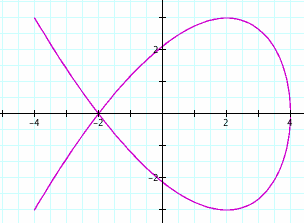
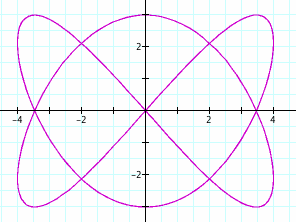
a = 4
b = 6
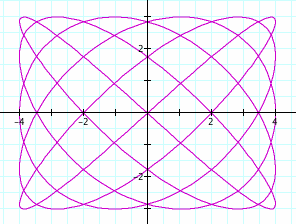
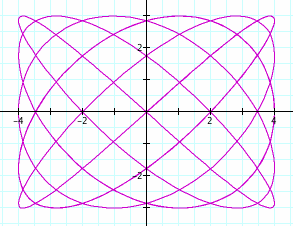
a = 5
b = 6
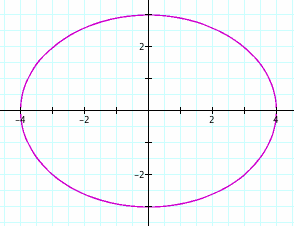
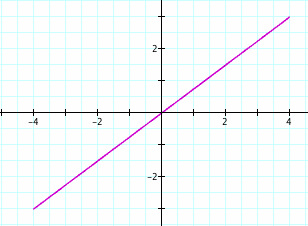
a = 6
b = 6
I observed that when a = 1,3, and 5, the graphs are the same.
I observed that in every graph the domain is (-4,4), and the range is (-3,3). 4 and 3 are the coefficients of cos and sin.
I observed that b/a for the graphs on the left tells you how many loops will appear, except when a = 5.
I observed that when a = b for the left graphs an ellipse is formed, but when a = b on the right a line segment is formed.
The ellipse formed has a major axis of length 8 and a minor axis of length 6.
The line segment formed has endpoints (-4,-3) and (4,3).
There is obviously a relation between these 2 separate parametric curves, but they are not the same curve.
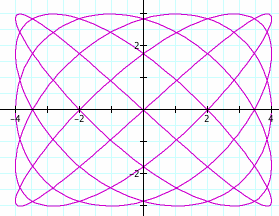
Then, I decided to look at
x = 4sin(at)
y = 3sin(bt)
I looked at the same values for a and b as the last set of graphs.
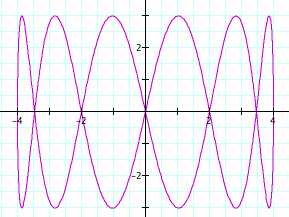
a = 1 b = 6 |
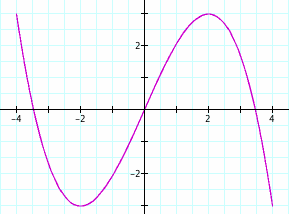
a = 2 b = 6 |
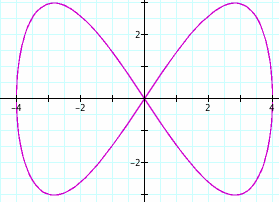
a = 3 b = 6 |
 |
 |
 |
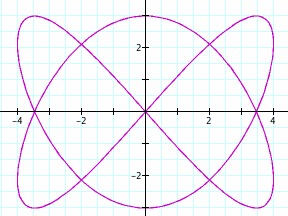
a = 4 b = 6 |
a = 5 b = 6 |
a = 6 b = 6 |
 |
 |
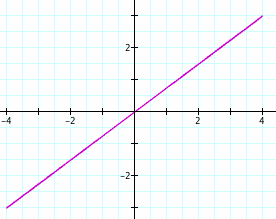 |
This set of graphs is identical to the set of Lissajous Curves for the same values of a and b.